UserBenchmark is run by a small company of hardcore geeks. Dedicated to providing visitors with top notch hardware research on tens of thousands of PC components.
Userbenchmark can help to identify and resolve problems with your windows PC. Mac OS / OS X and Linux are not currently supported.
- How to Benchmark
Userbenchmark has an easy-to-use benchmarking tool that can establish whether your PC is actually running slow and why. It may be that you have an outdated PC struggling to cope with modern apps or perhaps performance is hindered on an otherwise decent PC. Userbenchmark can help identify which is the most likely problem.
In order to test the speed of your processor, hard drive, graphics card, SSD and USB flash drive. Simply download the free Userbenchmark tool. So that the test can yield more accurate results, close down any unnecessary programs before clicking the run button shown below.
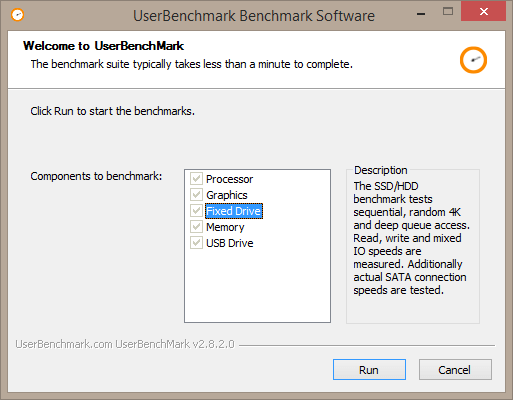
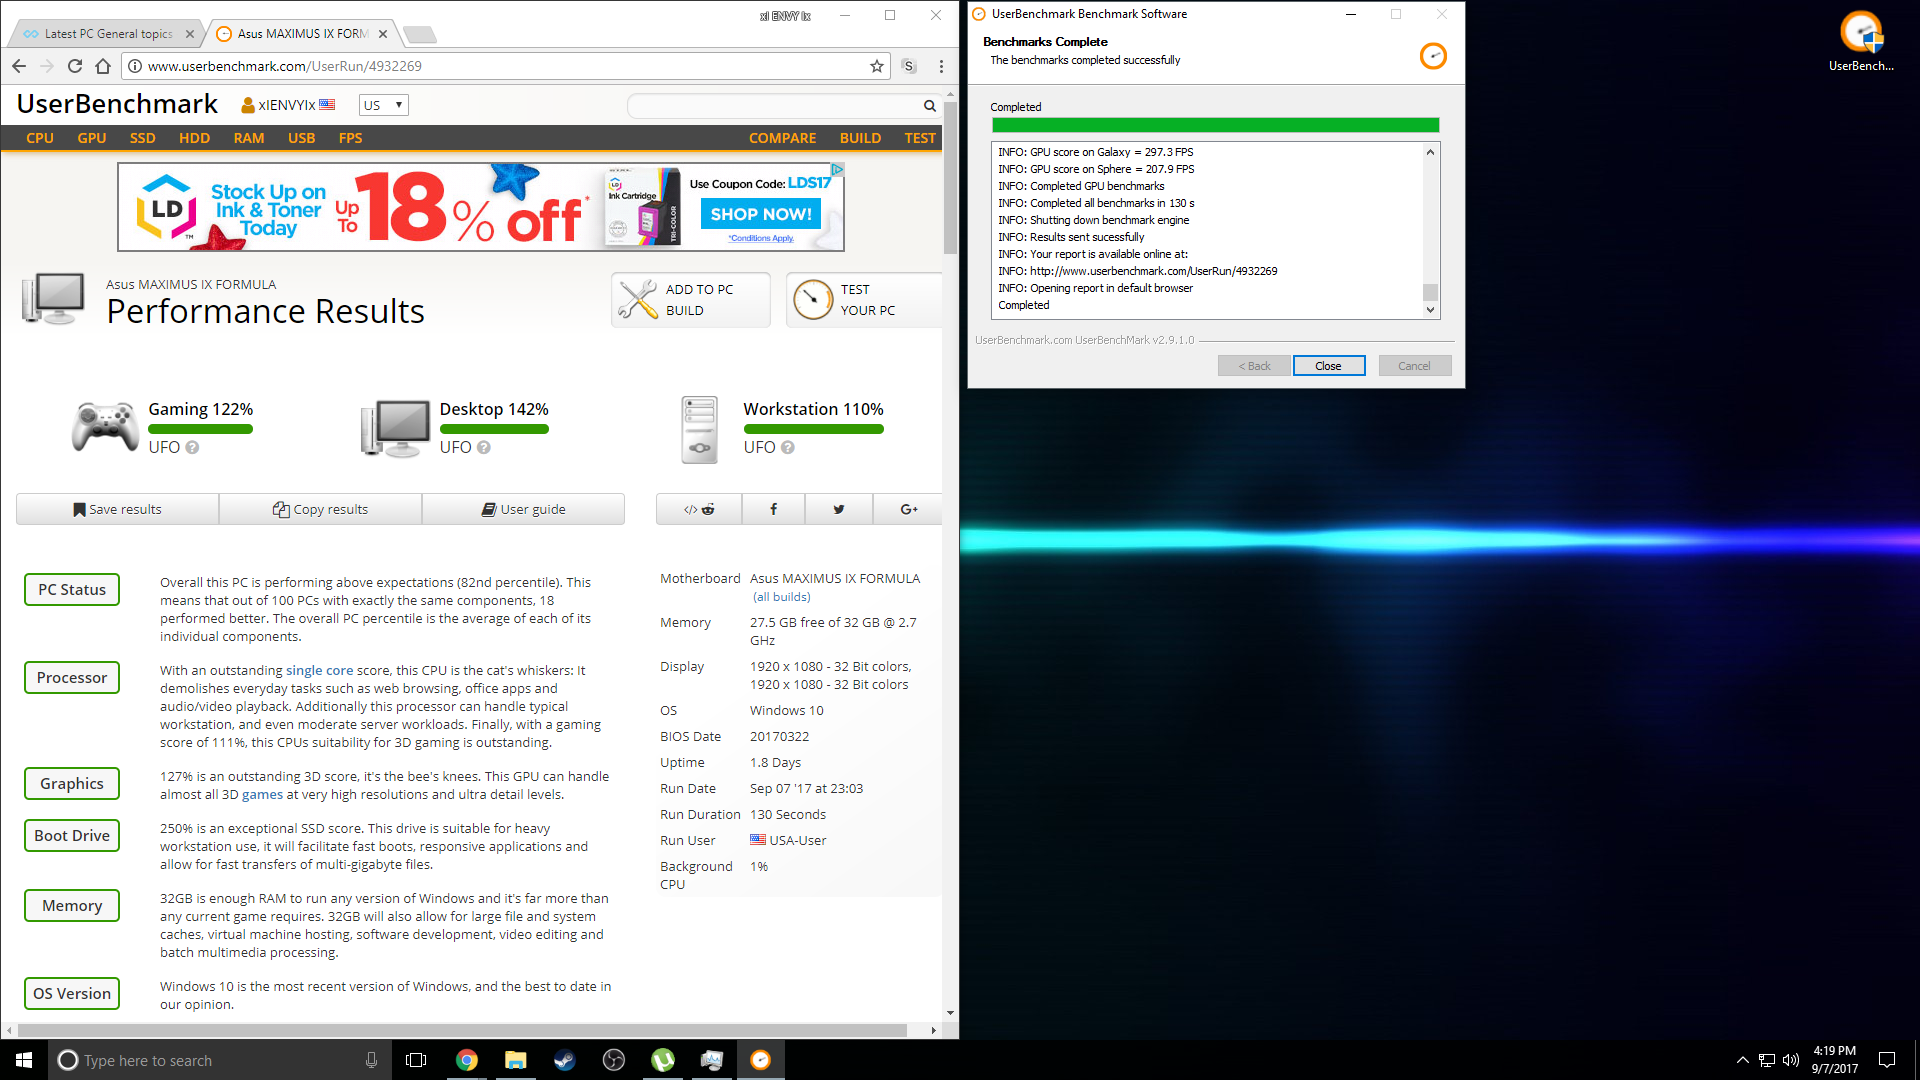
The test will take a couple of minutes to run depending on your setup and will then present you with a set of results on Userbenchmark.com.
Introduction
Still hankering for the day that you pulled your new PC out of the box, plugged it in and it just worked? Over time and use, your PC can slow down. This could be due to outdated hardware, and/or software issues.
Userbenchmark can help to identify and resolve problems with your windows PC. Mac OS / OS X and Linux are not currently supported.
How to interpret UserBenchmark results
The following section explains how to interpret the results for an example user benchmark.
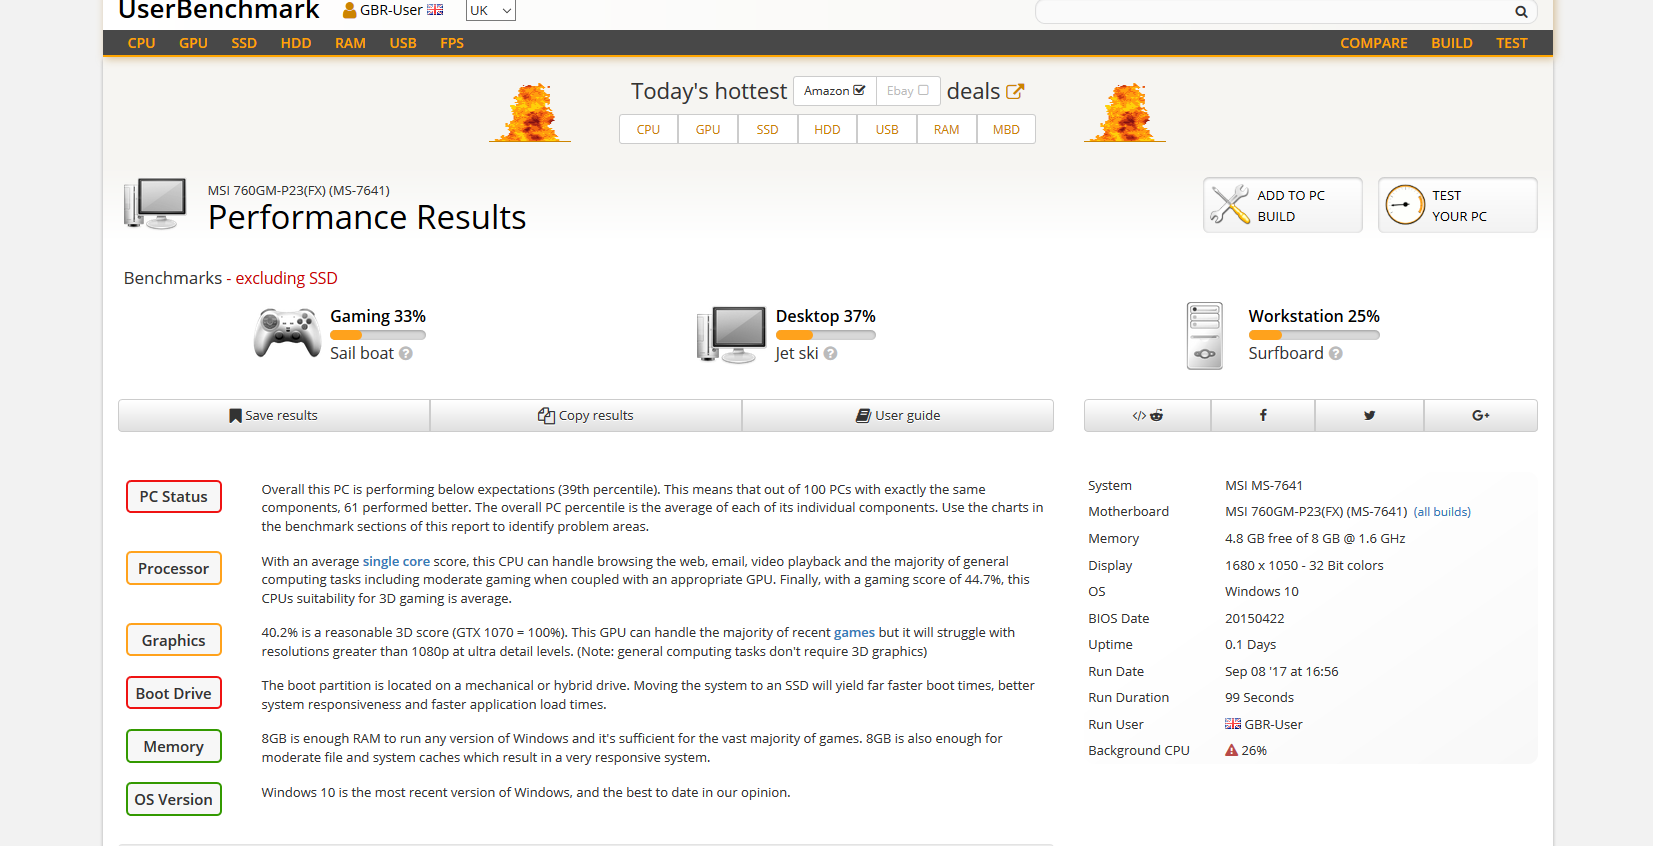
Build benchmarks
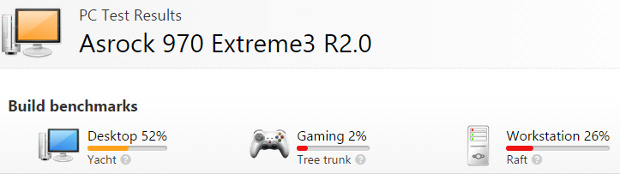
In this example, the PC scores a fair 52% for desktop, but is definitely not appropriate for gaming scoring only 2%. And as a workstation that requires multi-core processing, this PC scores a 27%, leaving plenty of room for improvement. Full details on each of the category calculations are available here.
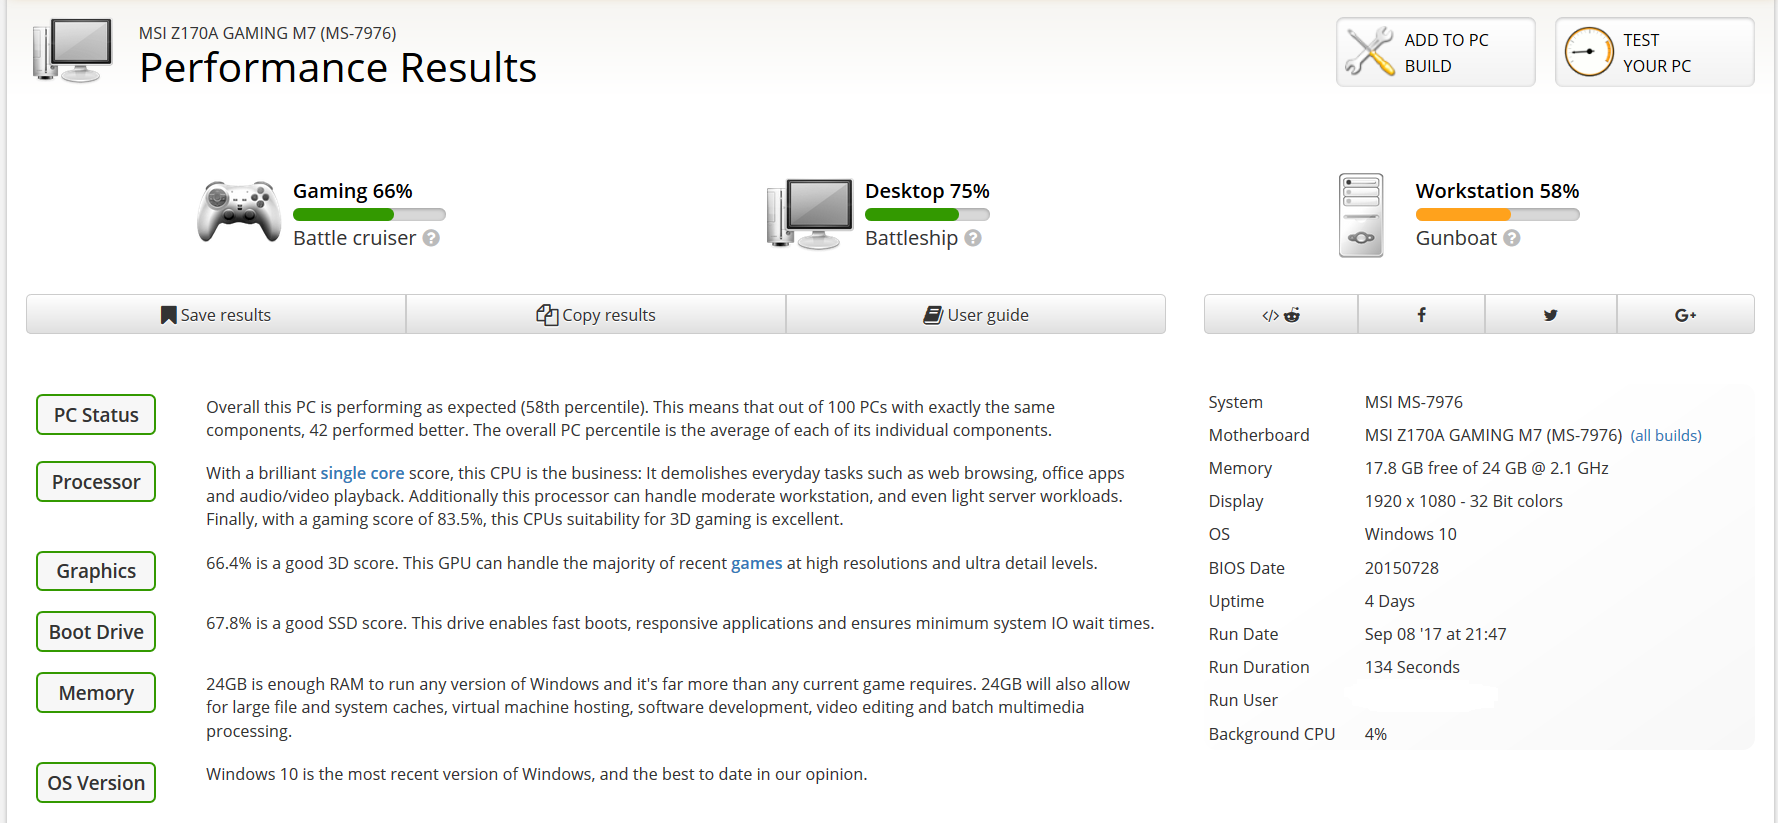
CPU score
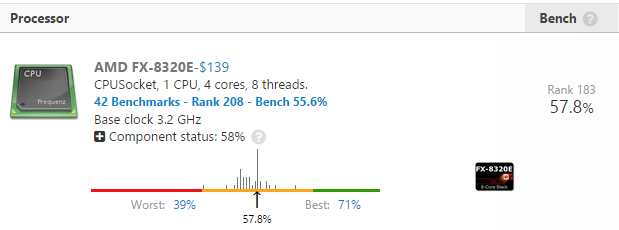
The AMD processor scores a benchmark of 57.8% based on single, quad and multi-core speed tests which is slightly higher than the average of all other 42 benchmarks for this processor (55.6%). Overall this is a fair CPU.
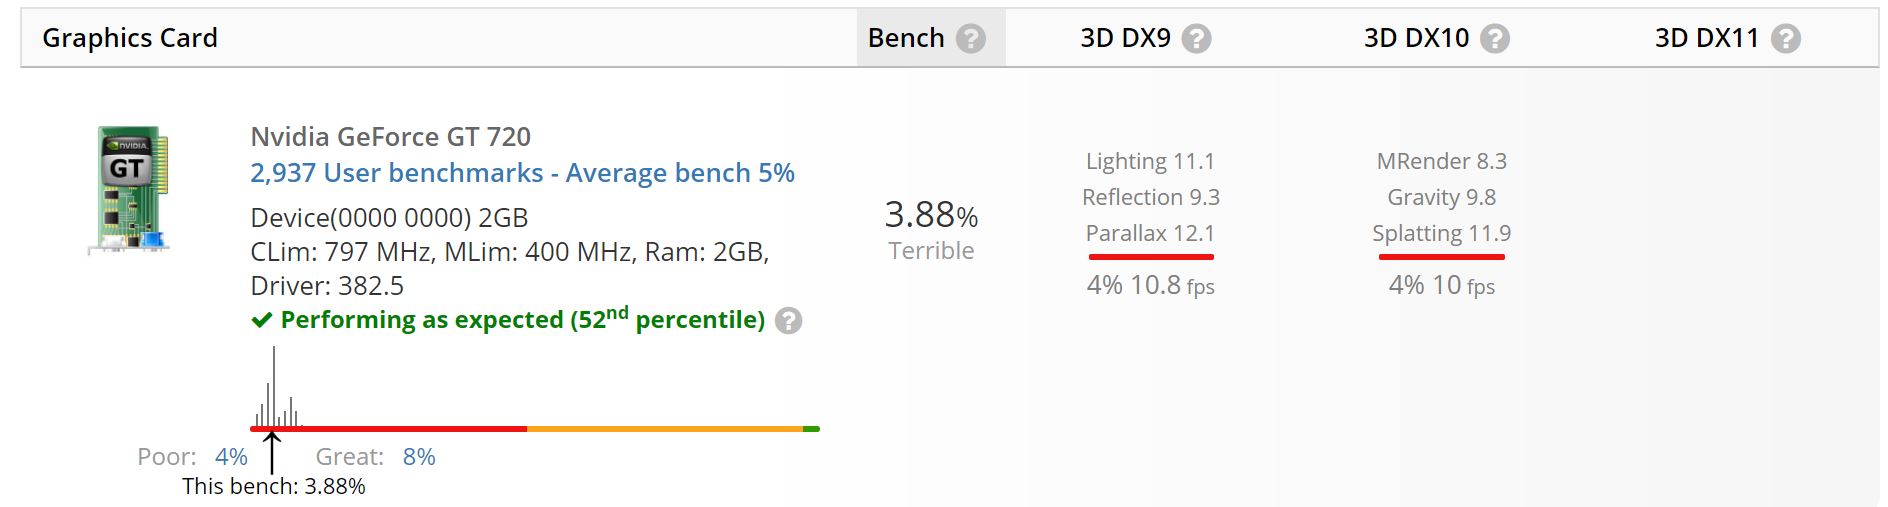
GPU score
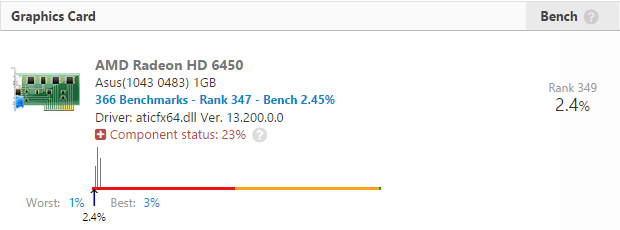
The graphics are definitely not good – scoring only 2.4% in the benchmark test. In reality this means you can’t play 3D games with this card and it may struggle to play some HD movies. Delving into the 366 benchmarks for this graphics card reveals consistently poor results indicating that this is a performance issue for this model of graphics card rather than this particular card.
HDD score
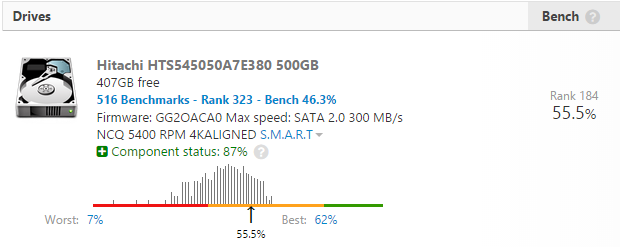
Looking at the drives now, the Hitachi hard disk seems to be performing optimally with a component status of 87% and scoring an average 55.5% for performance.
SSD score
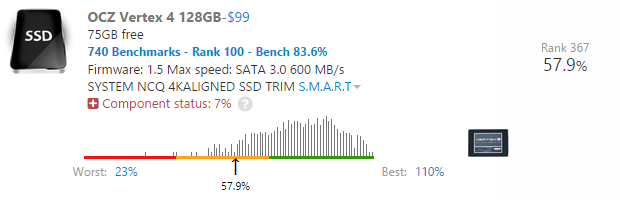
By contrast, the SSD, where this PC’s boot drive is located, only has a component status of 7%: it scores a reasonable 57.9% for performance, but on average, users with this SSD score 83.6%, so there is potentially an issue here.
Download available HERE
I’ll start a site ranking list for every one to compare. Screenshots are required to make the list. If you choose to make a profile (which is encouraged) Please use you WeMod username. Here is an example.
Good luck to all who enter!